Tips & Tricks
1 min Reading time
by Olaf Brandt
The new debug mode of the etracker tag manager considerably simplifies the testing and debugging of tags. When activated, all tags configured in the account can be checked in detail and their triggers can be tracked without sending data to etracker or third-party providers. This makes it possible to optimize tag implementation and ensure that all tags work as desired.
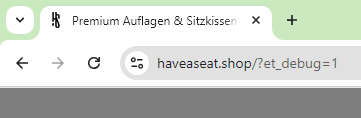
To activate the debug mode, simply add the parameter ?et_debug=1 to the URL of each page on which the etracker code is integrated.
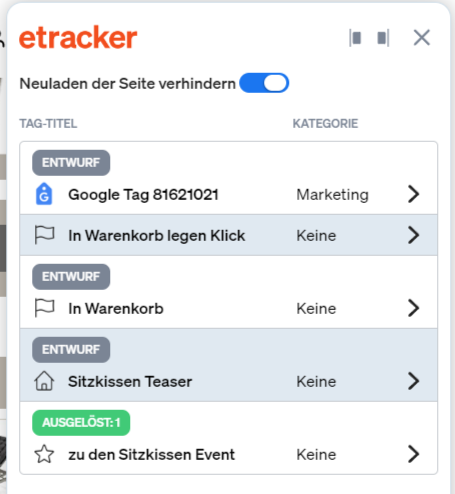
As soon as debug mode is activated, an overlay appears that provides detailed information on all configured tags.
This overlay can be moved to the right or left side of the screen as required, so that all elements of the website remain accessible.
The debug overlay can be closed at any time by clicking on the X in the overlay or by removing the parameter ?et_debug=1 from the URL.
A major advantage of debug mode is that the page reload can be prevented. This is particularly useful when testing tags that are based on triggers that lead to a page change.

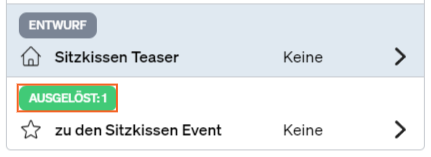
In debug mode, all tags that are configured in the account for the website in question are displayed, including tags that are still in the design stage. The display is independent of whether the tag is actually triggered on the current page. If a tag is triggered, this is displayed with the number of triggers in the overlay.
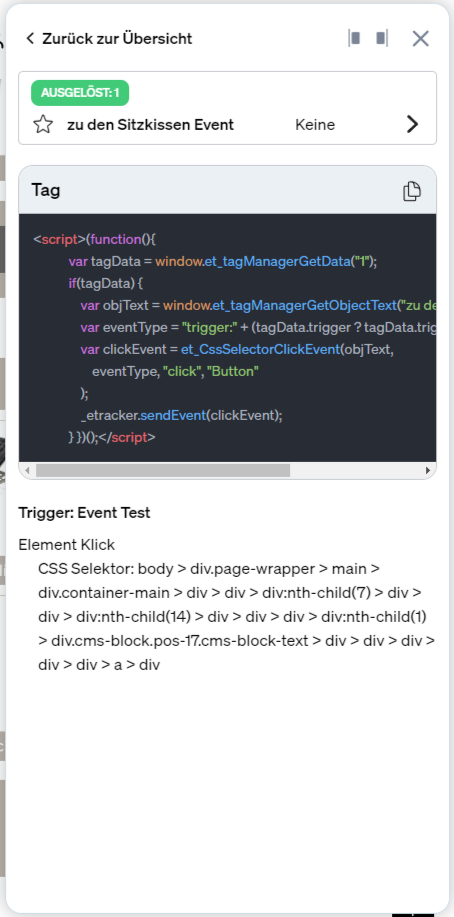
Tags are only triggered if the corresponding consent has been given. This allows the interaction between the etracker tag and consent manager to be tested. It is important to note that triggering tags in debug mode does not generate any data in the etracker account and no data is sent to third-party providers. Clicking on a tag in the overlay takes you to the detailed view, where you can see how the tag would be sent.
In the detail view, the entire tag is displayed as it would actually be sent. If the tag has not yet been triggered, the tag parameters that are filled with variables are not replaced and no information about the trigger is available. No trigger is displayed for global tags either.
This can happen if adding the parameter ?et_debug=1 does not result in a page reload. In this case, the parameter should be entered again and the current page reloaded.
If the tag has not yet been triggered, the variables are displayed as {{ID}}.
The tag has either not yet been triggered or it is a global tag that is triggered on every page.
In debug mode, the tags are not executed and therefore do not generate any data. This allows the tags to be tested without consequences.
The display of the overlay is probably blocked by so-called CSP headers.
In this case, the parameter *customer.etracker.com* must be included in the CSP headers.
With this information, you are well equipped to use the new debug mode of the etracker tag manager effectively and to optimize tag implementations.
You can find all the information from this article summarized once again in this video: